Enterprise / portfolio reporting
Portfolio governance platform
Linked SharePoint intake and modeled project activity to Power BI measures for a more consistent portfolio view.
Reporting platform built- Business question
- What observable project activity sits behind a portfolio-health measure?
- My role & scope
- BI and workflow reporting designer
- Consequential contribution
- I connected intake structure, project data modeling, and DAX measures so portfolio reporting had explainable inputs.
- Outcome
- The platform standardized reporting inputs and gave leadership a more consistent view of portfolio activity.
01 / Judgment
The problem and the choice
Fragmented trackers and inconsistent status narratives made it difficult to compare initiatives. A useful executive view needed common definitions and structured operating inputs.
Structure the project inputs before calculating portfolio status, with enough consistency for comparison and explanations stakeholders can follow.
02 / Delivery responsibility
What I owned
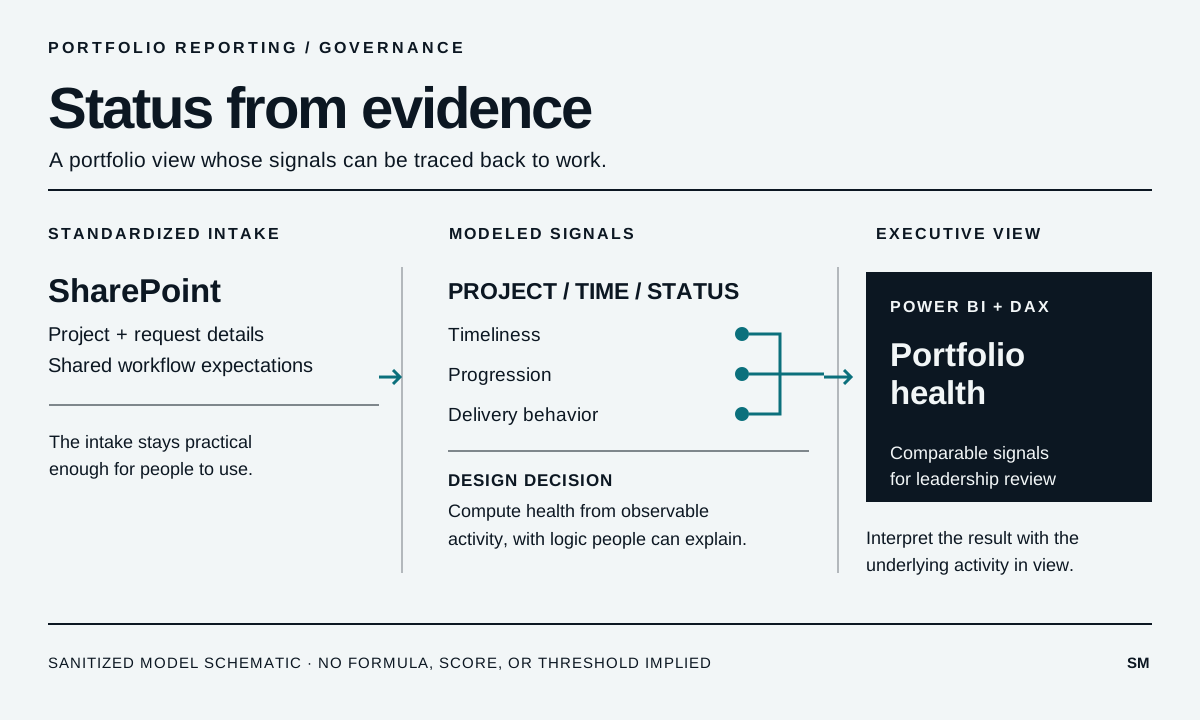
I used SharePoint for intake and operating records, modeled project and time data, and built Power BI and DAX measures for executive rollups. The design connected process structure to the reporting layer.
- Structured project intake and operating information in SharePoint.
- Modeled project, milestone, timing, and status attributes for reporting.
- Built Power BI and DAX measures for portfolio-health views and executive rollups.
03 / Working with others
How the work moved forward
The reporting served leadership oversight. My contribution was the BI and workflow reporting design, connecting project records to an explainable portfolio view.
04 / Technical detail
The implementation decisions
- Operating inputs
- SharePoint provided a common intake surface and project information instead of disconnected local trackers.
- Reporting model
- Project, milestone, timing, and status attributes were shaped for comparison across work and reporting periods.
- Semantic measures
- DAX translated modeled activity into portfolio-health measures. Actual formulas and thresholds are not published.
05 / Validation
Validation evidence
The documented design calls for comparing inputs across project types and periods and reviewing calculated health against delivery activity. Retained test results or acceptance records are not available in the public account.
06 / Outcome & status
What changed
The platform standardized reporting inputs and gave leadership a more consistent view of portfolio activity.
This case demonstrates BI and workflow reporting delivery. It does not imply ownership of the underlying project schedules, budgets, or outcomes.